SBCLTER time series data visualization
SBC LTER provides more than 40 long-term time series datasets, which are widely used in student projects and published articles. Below, you can explore the time series figures of commonly used variables. Click on each figure to view more details. If you like to modify the figures, please visit the GitHub repository where the R script could be edited to fit your needs.
Annual kelp forest community dynamics
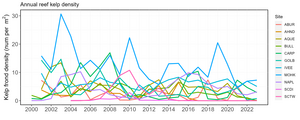
Annual kelp frond density

Annual fish density
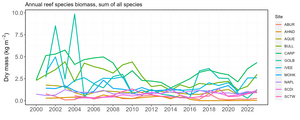
Annual reef species biomass
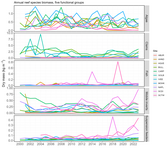
Annual reef species biomass in functional group
Kelp net primary production
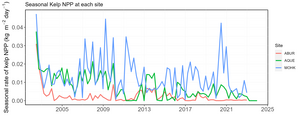
Kelp NPP Seasonal
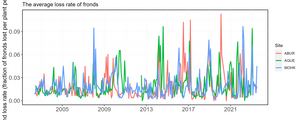
Kelp frond lost rate

Kelp frond CHN concentration
Key species
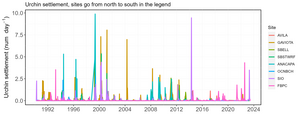
Urchin settlement on brushes
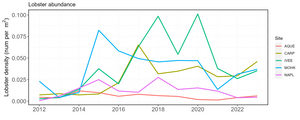
Lobster abundance
Beach habitats
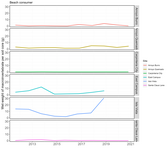
Beach consumer
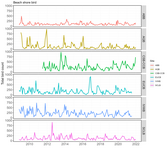
Beach shore birds
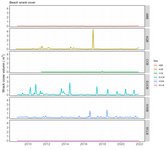
Beach wrack
Ocean environmental conditions
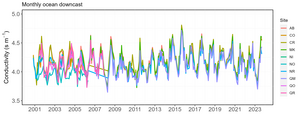
Conductivity during monthly CTD downcasts
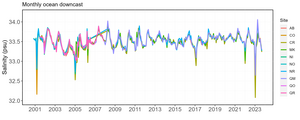
Salinity during monthly CTD downcasts
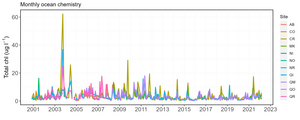
Total chl during monthly bottle sample
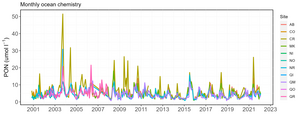
PON during monthly bottle sample
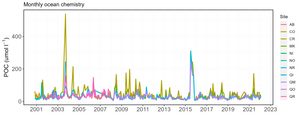
POC during monthly bottle sample
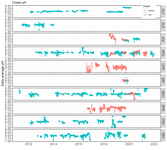
PH from SEAFET
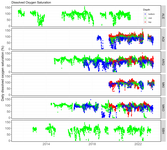
DO from miniDOT
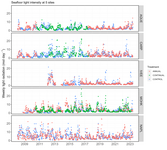
Seaflood irradiation
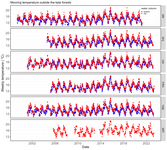
Temperature on mooring
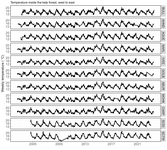
Temperature inside kelp beds